Over the past year, I’ve had many conversations—at conferences, with colleagues, and in my own learning journey—about how Spark compute works in Fabric. Coming from a classic SQL Server background, I initially found it challenging to grasp how compute is allocated and billed in Spark notebooks. The difficulty comes from how different Spark is compared to other Fabric workloads, which are “true” serverless SaaS services.
Understanding the compute engine you use is essential. In Microsoft Fabric, Spark operates as a Platform-as-a-Service (PaaS) engine within the broader Software-as-a-Service (SaaS) ecosystem. Unlike other Fabric workloads—such as Warehouse, where compute is billed per query or operation—Spark allocates dedicated compute resources to each developer.
If, like me, you come from a SQL background, you can think of this as having your own private server for running workloads. Once you’re done, it’s deallocated (shut down). While it is serverless, you still “pay” for the compute resources as long as they remain allocated—even if you’re running lightweight operations that only use a fraction of the allocated power.
This distinction is key: most Fabric workloads are designed as true SaaS services, where compute is managed dynamically. Spark, on the other hand, gives you dedicated compute, requiring a different mindset in terms of resource management and cost efficiency.
Last year, I wrote about Demystifying the Data Lakehouse in Fabric. Now, I want to do the same for Spark compute and CU consumption, another topic that often leaves people scratching their heads.
This blog post is my attempt to demystify how Spark compute and CU consumption work in Fabric. It’s also the first in a series, where I’ll explore how multiple developers share capacity and best practices for optimizing compute usage.
Let’s dive in!
Cluster, Pool, or Server? Understanding Spark Compute in Fabric
Your “server” in Fabric is actually a cluster of multiple machines (nodes), and in Fabric, this is called a Pool. When configuring a pool, you decide how many and how large the nodes should be. These are preconfigured in T-shirt sizes: S, M, L, XL, and XXL.
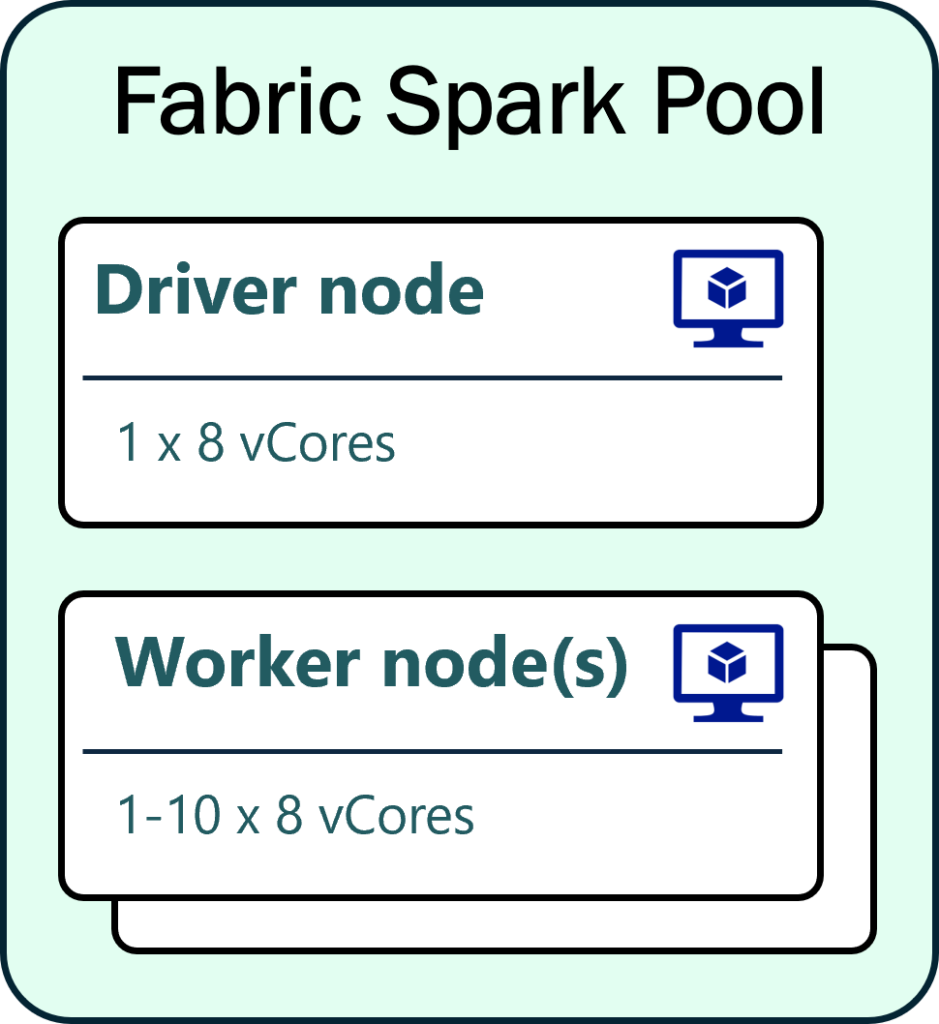
Components of a Spark Pool
A Spark pool always consists of:
- Driver Node: The central coordinator that receives and manages user requests.
- Executor Nodes: The actual workers executing the tasks.
Spark’s distributed nature enables scalable computing, making it ideal for handling large datasets and complex computations.
Billing and Compute Consumption
- Creating a Spark pool is free – you are only billed when your Spark job/notebook is active.
- When a job runs, Spark allocates nodes dynamically, and you’re billed for the active duration of your notebook session.
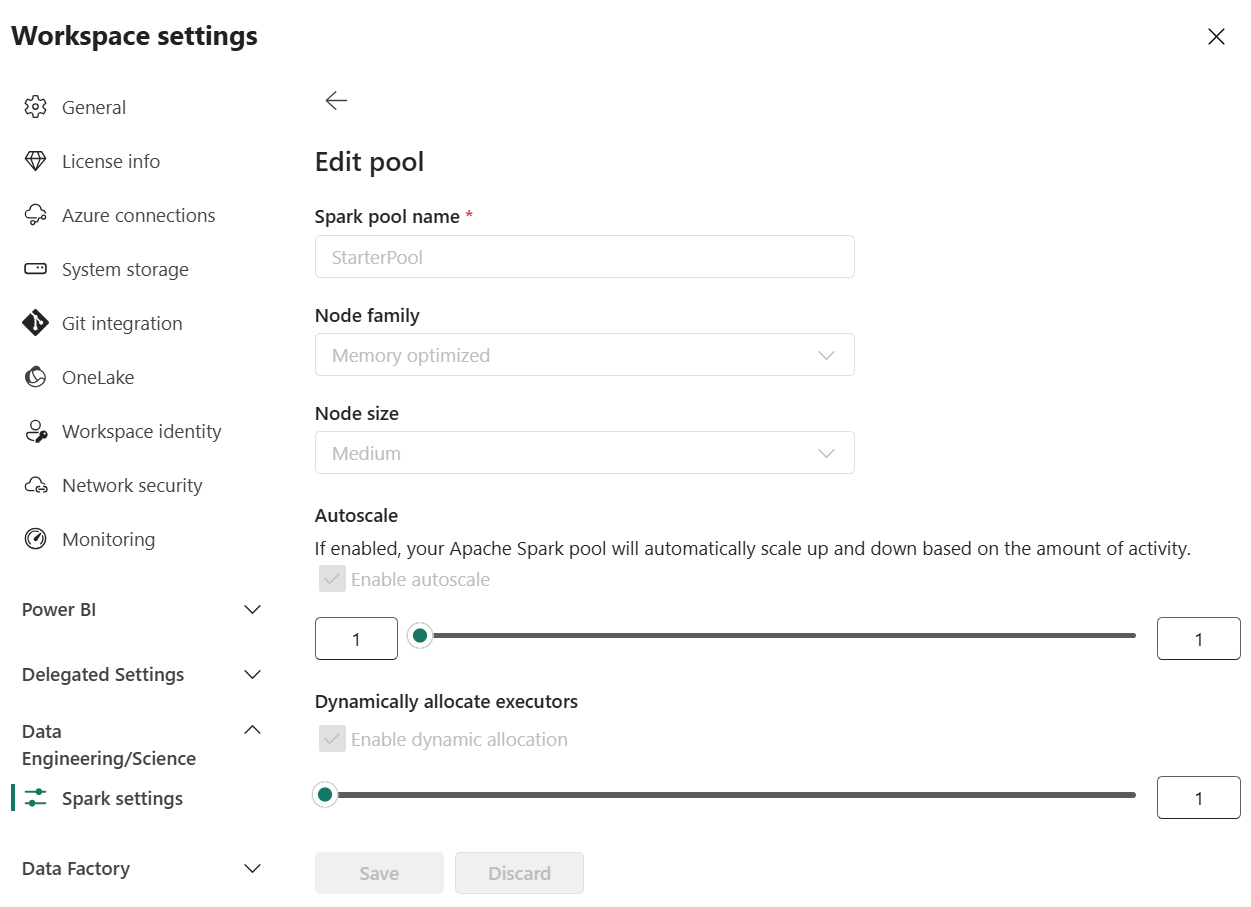
Understanding the Default Starter Pool
By default, Fabric assigns a Medium-sized Starter Pool, designed for fast startup times (within a few seconds).
Default Starter Pool Configuration:
- Autoscaling: 1 to 10 nodes
- Minimum allocation: 1 driver + 1 worker
- Each node: 8 vCores
- Minimum total allocation: 16 vCores (8 vCores x 2 nodes)
- CU Consumption:
- 2 Spark vCores = 1 Capacity Unit (CU)
- 16 vCores allocated = 8 CU per second during session activity
Scheduled vs. Interactive Notebooks
- Scheduled notebooks: Automatically start and stop when the job completes, consuming CU only for the duration of execution.
- Interactive sessions: Remain open until manually stopped. If left idle, they auto-shutdown after 20 minutes—but until then, they continue consuming CU.
Tip: Always stop your session manually when you’re done to avoid unnecessary CU usage!
Monitor CU Consumption in the Monitor Hub
Fabric provides built-in monitoring tools to help optimize Spark pool usage.
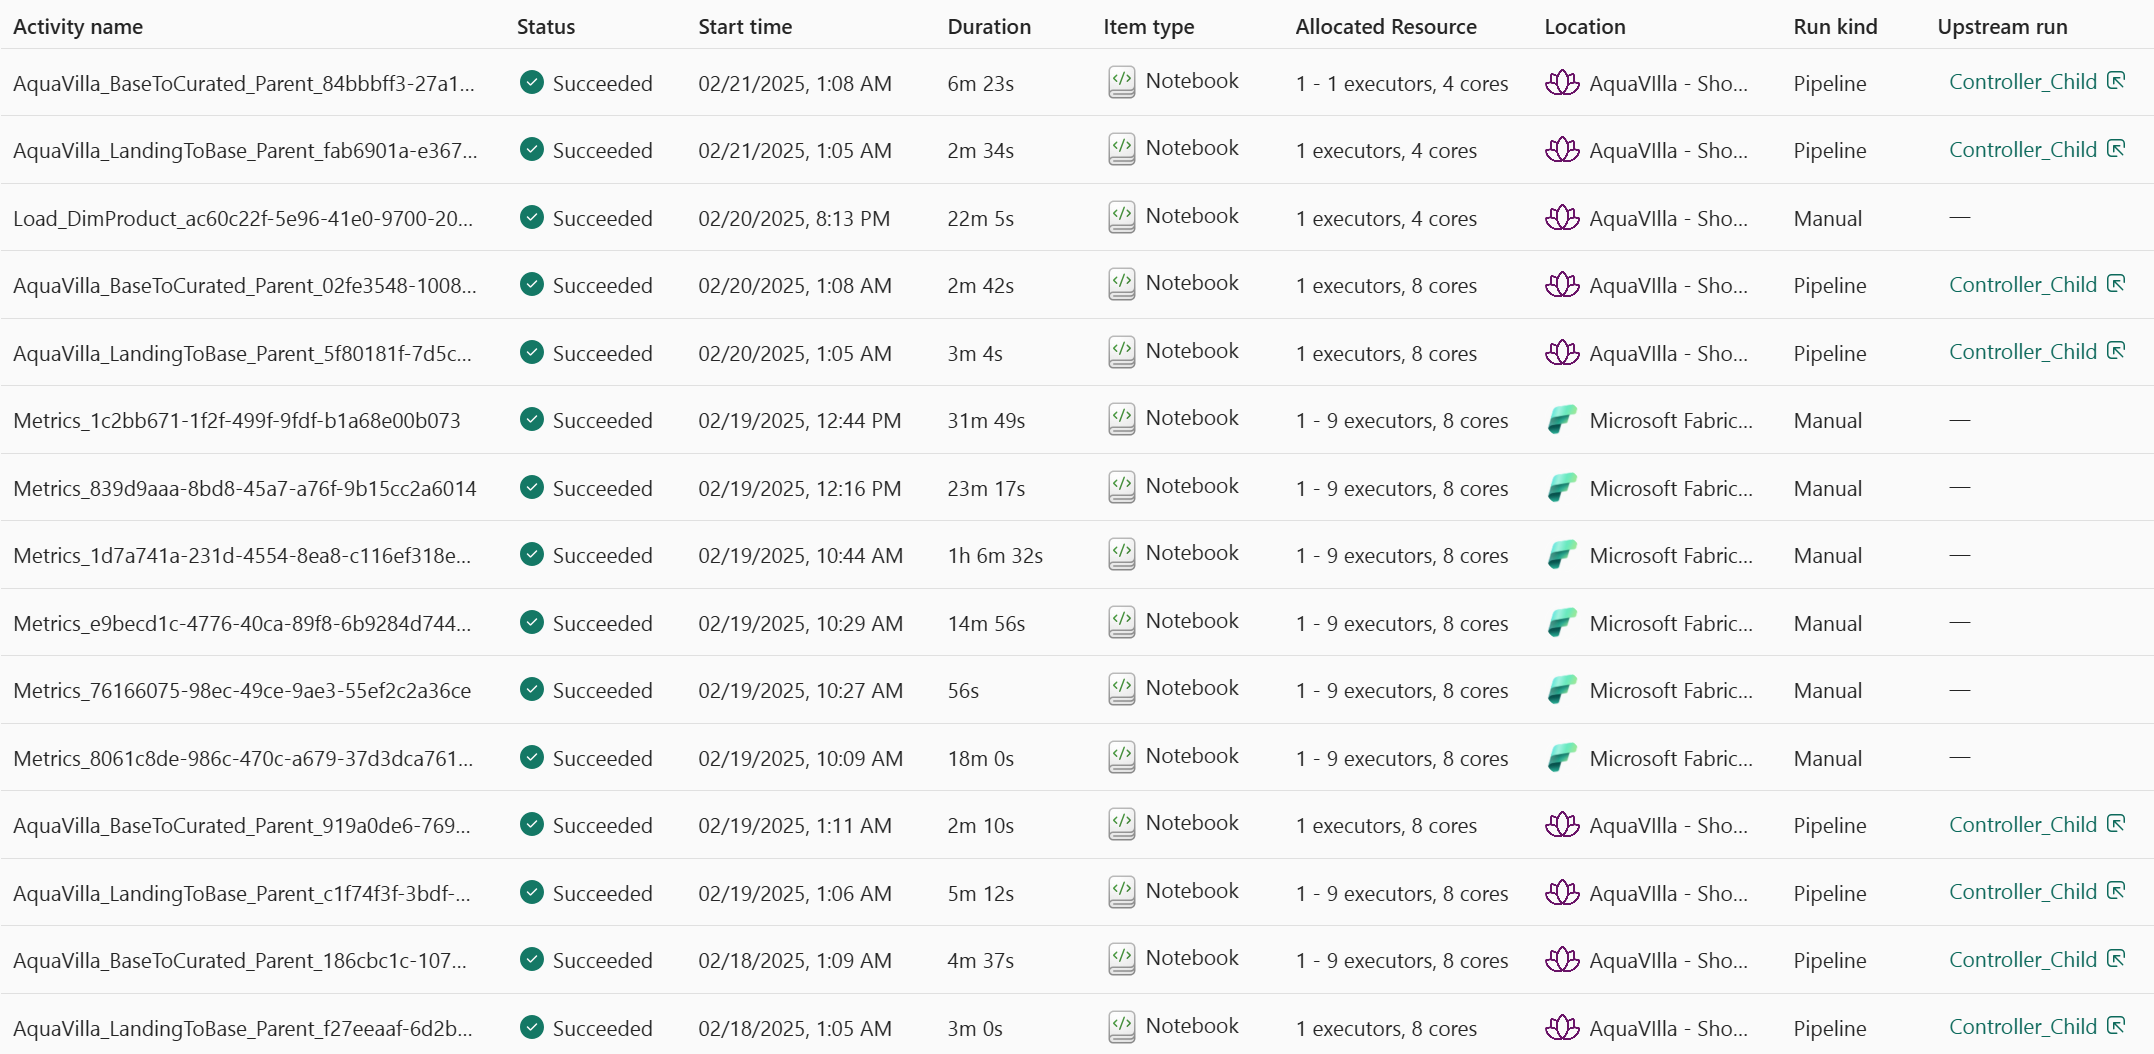
1. Monitor Hub
- Add Allocated Resources as a column to see how many executors and cores were used.
- This view does not show driver node usage.
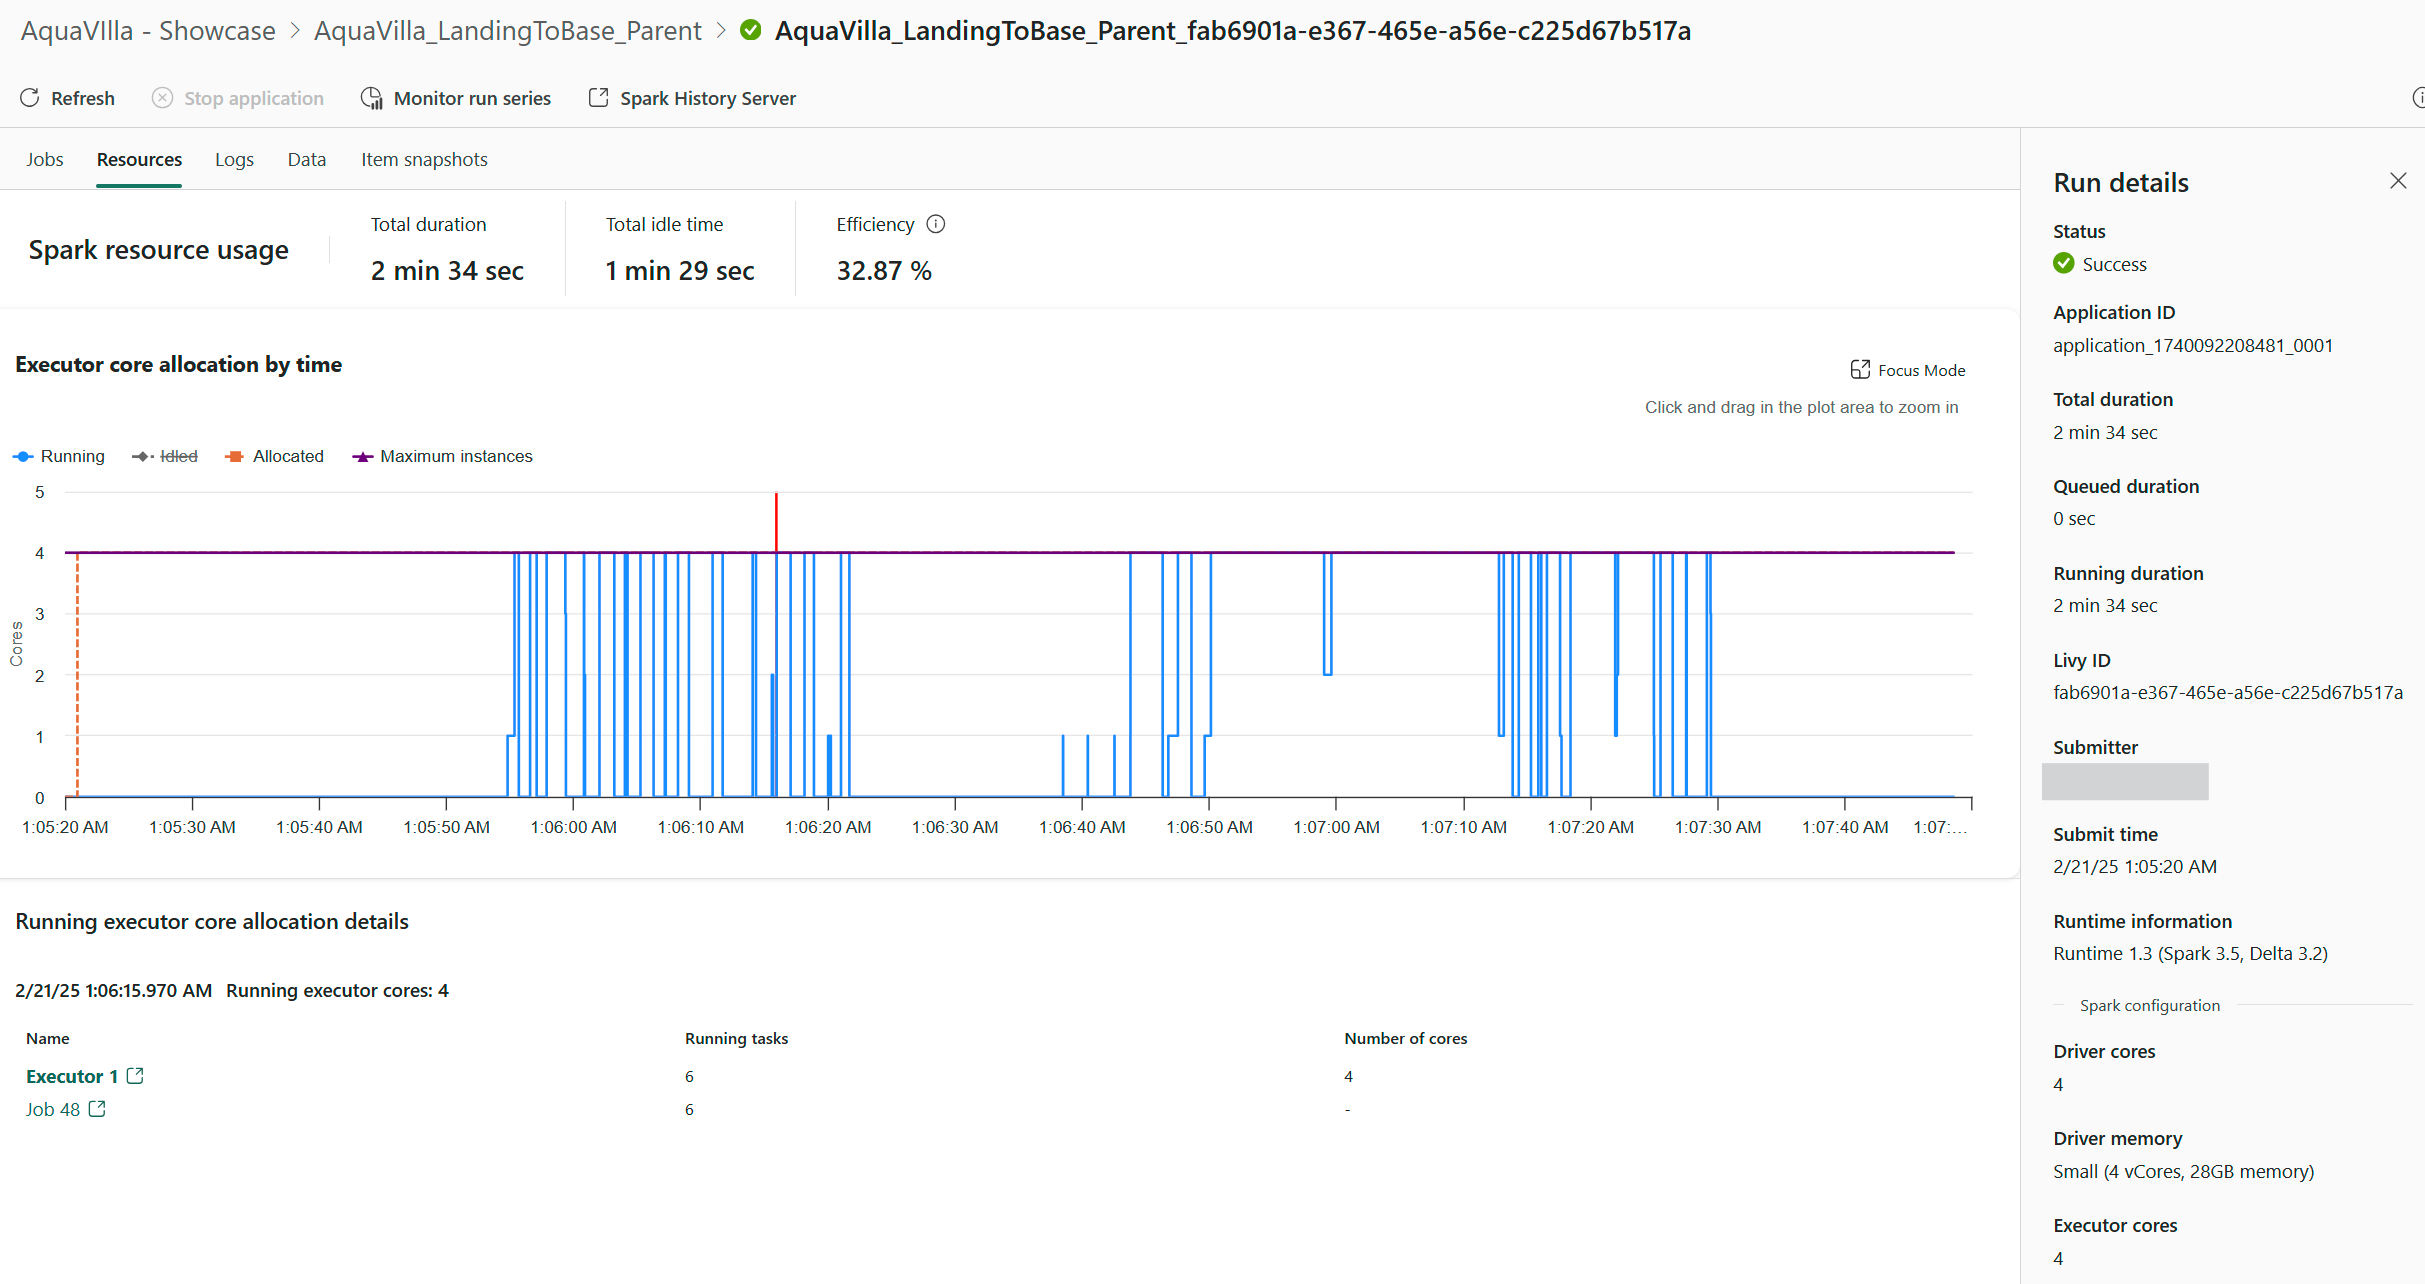
2. Run Details
Go a step deeper and click on the activity name and then display the Spark configuration details, including:
- Number of executors over time
- vCores used for drivers and workers
- Execution breakdowns (duration, resource allocation, etc.)
Upcoming Blog Post: I’ll explore the monitoring features more in debt in a coming post. Including how it relates to CU usage in the Capacity Metrics App.
Tips to Reduce CU Consumption
If you want to optimize costs, consider these strategies:
1. Use Single-Node Spark Pools
- Configure autoscale min/max nodes = 1 to run both driver and executor on the same node.
- This effectively halves CU usage for small workloads.
2. Lower Auto Shutdown Time
- Default idle timeout is 20 minutes.
- Reduce it in the workspace settings if your work sessions are shorter.
3. Use Python Notebooks for Small Workloads
- Spark is a distributed system—overhead can be costly for simple tasks.
- Instead, try Python notebooks (Preview).
- Default configuration: 2 vCores
- Lower CU consumption
- Supports Polars and delta-rs for efficient data processing.
My colleague Jimmy created a fantastic utility: MSFabricUtils—a collection of Spark-free Python tools for Fabric. Check it out here: https://mrjsj.github.io/msfabricutils/
Final Thoughts
- Fabric Spark notebooks provide dedicated compute, but managing CU consumption effectively is key.
- Monitor usage in Monitor Hub and Run Details to understand your actual resource allocation.
- Use Python notebooks or single-node Spark pools when possible to optimize costs.
- Always stop sessions manually to avoid unnecessary CU consumption or reduce the session timeout.
Stay tuned for more insights as this is just the beginning! In the next post, I’ll explore how multiple developers share the same Fabric capacity and what that means for CU consumption.
Pingback: Running Multiple Notebooks on the Same Capacity in Fabric Spark – justB smart
Pingback: Optimizing Fabric Spark with High Concurrency Mode – justB smart
Comments are closed.